
Overview
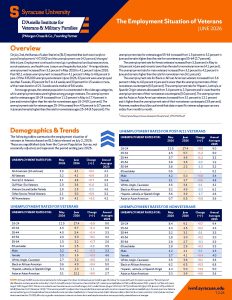
On July 2nd, the Bureau of Labor Statistics (BLS) reported that both total nonfarm payroll employment (+57,000) and the unemployment rate (4.2 percent) changed little in June. Employment continued to trend up in professional and business services, social assistance, and health care. Leisure and hospitality lost jobs.[1] Among veterans, unemployment increased from 3.2 percent in May 2026 to 4.1 percent in June 2026. Post-9/11 veteran unemployment increased from 4.1 percent in May to 4.8 percent in June. Of the 335,000 unemployed veterans in June 2026, 32 percent were unemployed less than 5 weeks, 35 percent for 5 to 14 weeks, and 33 percent for 15 weeks or more, with a mean duration of 21.3 weeks and a median of 8.6 weeks.
Across age groups, the veteran population is concentrated in the older age categories, while unemployment rates were highest among younger veterans. The unemployment rate for veterans ages 18–24 increased from 11.5 percent in May to 17.4 percent in June and remains higher than the rate for nonveterans ages 18–24 (9.1 percent). The unemployment rate for veterans ages 25–34 increased from 4.5 percent to 5.7 percent in June and remains higher than the rate for nonveterans ages 25–34 (4.5 percent). The unemployment rate for veterans ages 55–64 increased from 1.5 percent to 3.2 percent in June and remains higher than the rate for nonveterans ages 55–64 (2.7 percent).
The unemployment rate for female veterans increased from 3.3 percent in May to 3.6 percent in June and remains lower than the rate for nonveteran women (4.1 percent). The unemployment rate for male veterans increased from 3.2 percent to 4.2 percent in June and remains higher than the rate for nonveteran men (4.1 percent).
The unemployment rate for Black or African American veterans increased from 3.6 percent in May to 4.0 percent in June and is lower than the unemployment rate of their nonveteran counterparts (6.5 percent). The unemployment rate for Hispanic, Latino/a, or Spanish Origin veterans decreased from 3.4 percent to 2.3 percent and is lower than the unemployment rate of their nonveteran counterparts (5.0 percent). The unemployment rate for Asian or Asian American veterans increased from 3.1 percent to 12.1 percent and is higher than the unemployment rate of their nonveteran counterparts (3.9 percent). However, readers should be cautioned that data on specific veteran subgroups can vary widely from month to month.
Demographics & Trends
The following tables summarize the employment situation of veterans in America based on BLS data released on July 2, 2026. These are unpublished data from the Current Population Survey, not seasonally adjusted, and represent the period ending June 2026.
| UNEMPLOYMENT RATES FOR: | May 2026 | June 2026 | CHANGE (+/-) | Annual Averages 2025 |
| All Americans (18 and over) | 3.9 | 4.1 | +0.2 | 4.1 |
| All Veterans | 3.2 | 4.1 | +0.9 | 3.5 |
| Post-9/11 Veterans | 4.1 | 4.8 | +0.7 | 3.6 |
| Gulf-War I Era Veterans | 2.0 | 3.6 | +1.6 | 3.2 |
| Vietnam Era and Earlier Periods | 2.8 | 2.5 | -0.3 | 4.6 |
| Other service period veterans | 2.1 | 3.0 | +0.9 | 3.2 |
| All Nonveterans | 3.9 | 4.1 | +0.2 | 4.2 |
| UNEMPLOYMENT RATES FOR VETERANS | ||||
| Demographic Category | May 2026 | June 2026 | CHANGE (+/-) | Annual Averages 2025 |
| 18–24 | 11.5 | 17.4 | +5.9 | 9.0 |
| 25-34 | 4.5 | 5.7 | +1.2 | 5.0 |
| 35-44 | 4.0 | 5.4 | +1.4 | 3.3 |
| 45-54 | 2.9 | 3.0 | +0.1 | 3.2 |
| 55-64 | 1.5 | 3.2 | +1.7 | 2.6 |
| 65 and older | 3.4 | 2.5 | -0.9 | 3.9 |
|
|
|
|
|
|
| Male | 3.2 | 4.2 | +1.0 | 3.3 |
| Female | 3.3 | 3.6 | +0.3 | 4.6 |
|
|
|
|
|
|
| White, Anglo, Caucasian | 2.7 | 3.2 | +0.5 | 3.3 |
| Black or African American | 3.6 | 4.0 | +0.4 | 5.0 |
| Hispanic, Latino/a, or Spanish Origin | 3.4 | 2.3 | -1.1 | 4.0 |
| Asian or Asian American | 3.1 | 12.1 | +9.0 | 2.7 |
| UNEMPLOYMENT RATES FOR POST-9/11 VETERANS | ||||
| Demographic Category | May 2026 | June 2026 | CHANGE (+/-) | Annual Averages 2025 |
| 18–24 | 11.5 | 17.4 | +5.9 | 9.0 |
| 25-34 | 4.5 | 5.7 | +1.2 | 5.0 |
| 35-44 | 3.7 | 4.9 | +1.2 | 3.3 |
| 45-54 | 3.8 | 3.6 | -0.2 | 1.9 |
| 55-64 | 3.6 | 2.3 | -1.3 | 3.2 |
| 65 and older | 0.6 | – | – | 0.2 |
|
|
|
|
|
|
| Male | 4.2 | 5.0 | +0.8 | 3.4 |
| Female | 3.1 | 3.7 | +0.6 | 4.8 |
|
|
|
|
|
|
| White, Anglo, Caucasian | 3.5 | 3.4 | -0.1 | 3.2 |
| Black or African American | 5.2 | 4.9 | -0.3 | 6.1 |
| Hispanic, Latino/a, or Spanish Origin | 5.6 | 3.9 | -1.7 | 4.6 |
| Asian or Asian American | 0.7 | 6.5 | +5.8 | 3.6 |
| UNEMPLOYMENT RATES FOR NONVETERANS | ||||
| Demographic Category | May 2026 | June 2026 | CHANGE (+/-) | Annual Averages 2025 |
| 18–24 | 8.4 | 9.1 | +0.7 | 9.4 |
| 25-34 | 4.3 | 4.5 | +0.2 | 4.3 |
| 35-44 | 3.2 | 3.1 | -0.1 | 3.3 |
| 45-54 | 2.8 | 3.0 | +0.2 | 3.0 |
| 55-64 | 2.8 | 2.7 | -0.1 | 2.9 |
| 65 and older | 2.8 | 2.9 | +0.1 | 3.3 |
|
|
|
|
|
|
| Male | 4.2 | 4.1 | -0.1 | 4.3 |
| Female | 3.7 | 4.1 | +0.4 | 4.0 |
|
|
|
|
|
|
| White, Anglo, Caucasian | 3.5 | 3.6 | +0.1 | 3.6 |
| Black or African American | 6.2 | 6.5 | +0.3 | 6.8 |
| Hispanic, Latino/a, or Spanish Origin | 4.4 | 5.0 | +0.6 | 5.0 |
| Asian or Asian American | 3.3 | 3.9 | +0.6 | 3.6 |
NOTE: Although the BLS reports national estimates for civilians ages 16 and over, the tables above are limited to ages 18 and over for comparability with the veteran population. “Period of service” identifies when a veteran served on active duty in the U.S. Armed Forces (not the location of service). Post-9/11 veterans are classified as Gulf War era II (September 2001–present). Gulf War era I covers August 1990–August 2001. Vietnam-era and earlier wartime veterans are a combined category that includes Vietnam (August 1964–April 1975), the Korean War (July 1950–January 1955), and World War II (December 1941–December 1946). “Other service periods” includes all other time periods. Veterans who served in more than one wartime period are classified only in the most recent one. Veterans who served during one of the selected wartime periods and another period are classified only in the wartime period. A dash indicates no data or data that do not meet publication criteria (values not shown where base is less than 75,000). Minority-by-gender unemployment rates are not shown due to small sample size and are more appropriately presented as annual averages.
[1] https://www.bls.gov/news.release/archives/empsit_07022026.pdf