
Overview
On May 6th, the Bureau of Labor Statistics (BLS) reported that employment increased by 428,000 in April, and the unemployment rate was unchanged at 3.6 percent, the U.S. Bureau of Labor Statistics reported today. Job growth was widespread, led by gains in leisure and hospitality, in manufacturing, and in transportation and warehousing.[1] For veterans, unemployment increased from 2.4 percent to 2.9 percent in April. Post-9/11 veteran unemployment increased from 3.0 percent to 3.4 percent. Of the total 260,000 unemployed veterans ages 18 and over, 32 percent have been unemployed for less than five weeks and 68 percent have been unemployed for more than five weeks. The average length of unemployment is 28.7 (the median is 14.9 weeks). The overall unemployment trend varies by different veteran demographic factors, however, some more than others.
With respect to age, the unemployment rate for veterans ages 18-24 decreased in April, from 8.8 percent to 7.5 percent. The unemployment rate for veterans ages 25-34 increased from 4.5 percent to 6.5 percent. During this period, veterans ages 18-24 were unemployed at a higher rate than their nonveteran peers of the same age group (7.1 percent). Veterans 25-34 were unemployed at a higher rate than their nonveteran peers of the same age group (3.7 percent). The unemployment rate for veterans ages 65 and older increased in April, from 3.1 percent to 3.8 percent. Veterans ages 65 and older were unemployed at a higher rate than their nonveteran peers of the same age group in April (2.7 percent).
The unemployment rate for female veterans increased in April, from 1.7 percent to 2.7 percent. By comparison, female nonveterans have an unemployment rate of 3.0 percent. The unemployment rate for male veterans increased in April to 2.9 percent. By comparison, male nonveterans have an unemployment rate of 3.6 percent.
The unemployment rate for Black or African American veterans increased to 5.0 percent in April. This rate is lower than the unemployment rate of their nonveteran counterparts (5.5 percent). The unemployment rate for Hispanic, Latino/a, or Spanish Origin veterans decreased to 2.8 percent in April. This rate is lower than the unemployment rate of their nonveteran counterparts (3.8 percent). Readers should be cautioned, however, that data on specific veteran subgroups can vary widely from month to month.
Demographics & Trends
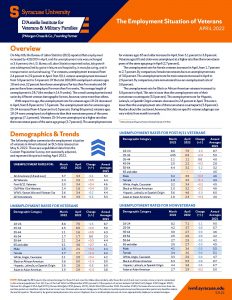
The following tables summarize the employment situation of veterans in America based on BLS data released on May 6, 2022. These are unpublished data from the Current Population Survey, not seasonally adjusted, and represent the period ending April 2022.
| UNEMPLOYMENT RATES FOR: | March 2022 | April 2022 | CHANGE (+/-) | Annual Averages 2021 |
| All Americans (18 and over) | 3.7 | 3.3 | -0.4 | 5.3 |
| All Veterans | 2.4 | 2.9 | +0.5 | 4.4 |
| Post-9/11 Veterans | 3.0 | 3.4 | +0.4 | 4.6 |
| Gulf-War I Era Veterans | 1.4 | 1.8 | +0.4 | 3.5 |
| WWII, Korean War and Vietnam Era | 3.6 | 3.4 | -0.2 | 4.4 |
| All Nonveterans | 3.8 | 3.3 | -0.5 | 5.3 |
| UNEMPLOYMENT RATES FOR VETERANS | ||||
| Demographic Category | March 2022 | April 2022 | CHANGE (+/-) | Annual Averages 2021 |
| 18–24 | 8.8 | 7.5 | -1.3 | 8.7 |
| 25-34 | 4.5 | 6.5 | +2.0 | 5.9 |
| 35-44 | 1.1 | 1.6 | +0.5 | 4.3 |
| 45-54 | 1.7 | 1.7 | 0.0 | 3.3 |
| 55-64 | 2.1 | 2.4 | +0.3 | 4.4 |
| 65 and older | 3.1 | 3.8 | +0.7 | 4.1 |
|
|
|
|
|
|
| Male | 2.5 | 2.9 | +0.4 | 4.4 |
| Female | 1.7 | 2.7 | +1.0 | 4.2 |
|
|
|
|
|
|
| White, Anglo, Caucasian | 2.1 | 2.5 | +0.4 | 4.2 |
| Black or African American | 3.6 | 5.0 | +1.4 | 5.0 |
| Hispanic, Latino/a, or Spanish Origin | 3.6 | 2.8 | -0.8 | 6.0 |
| Asian or Asian American | 1.9 | 2.9 | +1.0 | 3.8 |
| UNEMPLOYMENT RATES FOR POST-9/11 VETERANS | ||||
| Demographic Category | March 2022 | April 2022 | CHANGE (+/-) | Annual Averages 2021 |
| 18–24 | 8.8 | 7.5 | -1.3 | 8.7 |
| 25-34 | 4.5 | 6.5 | +2.0 | 5.9 |
| 35-44 | 1.1 | 1.1 | 0.0 | 4.0 |
| 45-54 | 2.0 | 2.2 | +0.2 | 2.8 |
| 55-64 | 4.4 | 3.2 | -1.2 | 3.2 |
| 65 and older | – | – | – | 4.5 |
|
|
|
|
|
|
| Male | 3.2 | 3.5 | +0.3 | 4.6 |
| Female | 1.8 | 3.0 | +1.2 | 4.9 |
|
|
|
|
|
|
| White, Anglo, Caucasian | 3.2 | 3.4 | +0.2 | 4.5 |
| Black or African American | 1.0 | 3.2 | +2.2 | 4.6 |
| Hispanic, Latino/a, or Spanish Origin | 5.6 | 4.6 | -1.0 | 6.0 |
| Asian or Asian American | 1.8 | 2.3 | +0.5 | 4.9 |
| UNEMPLOYMENT RATES FOR NONVETERANS | ||||
| Demographic Category | March 2022 | April 2022 | CHANGE (+/-) | Annual Averages 2021 |
| 18–24 | 8.2 | 7.1 | -1.1 | 9.5 |
| 25-34 | 4.2 | 3.7 | -0.5 | 5.7 |
| 35-44 | 3.0 | 2.7 | -0.3 | 4.6 |
| 45-54 | 2.5 | 2.0 | -0.5 | 4.2 |
| 55-64 | 2.7 | 2.5 | -0.2 | 4.2 |
| 65 and older | 3.0 | 2.7 | -0.3 | 4.5 |
|
|
|
|
|
|
| Male | 4.1 | 3.6 | -0.5 | 5.5 |
| Female | 3.4 | 3.0 | -0.4 | 5.1 |
|
|
|
|
|
|
| White, Anglo, Caucasian | 3.3 | 2.9 | -0.4 | 4.7 |
| Black or African American | 6.3 | 5.5 | -0.8 | 8.7 |
| Hispanic, Latino/a, or Spanish Origin | 4.4 | 3.8 | -0.6 | 6.7 |
| Asian or Asian American | 2.7 | 2.9 | +0.2 | 5.0 |
NOTE: Although the BLS reports the national average for those 16 and over, the tables above include only those that are 18 and over to make a more accurate comparison to the veteran population. Post-9/11 are of the Gulf War Era II (September 2001-present). Other periods of service include Gulf War Era I (August 1990-August 2001), Vietnam Era (August 1964-April 1975), Korean War (July 1950-January 1955), World War II (December 1941-December 1946). Veterans who served in more than one wartime period are classified only in the most recent one. Veterans who served during one of the selected wartime periods and another peacetime period are classified only in the wartime period. The minority-by-gender unemployment rates are not displayed due to small sample size and are more appropriately displayed as annual averages
[1] https://www.bls.gov/news.release/empsit.nr0.htm