Enhancing Veterans’ Access to STEM Education and Careers: A Labor Market Analysis of Veterans in the STEM Workforce - D'Aniello Institute for Veterans and Military Families

Enhancing Veterans’ Access to STEM Education and Careers: A Labor Market Analysis of Veterans in the STEM Workforce

Highlights of Full Report:

  • 150+ pages of further findings and analysis from veterans in the STEM workforce
  • Detailed findings and analysis of veterans in STEM within all 50 states
  • Detailed findings and analysis of veterans in STEM within all metropolitan areas
  • Detailed findings and analysis of the employment characteristics of veterans in STEM

The nation’s future and economic competitiveness hinge, more than ever, on our ability to develop, grow, and sustain a workforce proficient in science, technology, engineering and math (STEM). In the last decade alone, jobs requiring some level of STEM expertise have grown 34 percent—to include jobs that do not require a bachelor’s degree. At the same time, veterans and transitioning service members represent a valuable, skilled talent pool from which to help meet this critical need.

To this broader purpose, the Institute for Veterans and Military Families (IVMF) recently provided research support to the Council for Adult and Experiential Learning (CAEL), in collaboration with the Helmsley Charitable Trust, in an effort to inform the development of local and regional STEM ecosystems of educators and employers aimed increasing veterans’ access to STEM careers. Specifically, the project intended to better equip local postsecondary institutions and employers with the collaborative tools and information needed to successfully align education, training, and employer needs in STEM, alongside efforts to recruit and retain veterans into local employment opportunities.

This research brief presents key highlights on recent veteran participation in the STEM workforce drawing upon an analysis of the American Community Survey (2012-2016), led by the U.S. Census Bureau. From this data, the research team examined veteran participation across 49 distinct STEM occupations, which are grouped into the following five occupational clusters: Engineering, Information Technology and Computer Science, Life and Physical Sciences, Mathematics, and Supervisor/ Management of STEM occupations. Among other analyses, the research team identified year-over-year trends in veteran participation, geographic distribution, and comparisons to non-veterans across all STEM occupations.

These results provide insight into how veterans are doing in the U.S. STEM workforce. They also reveal opportunities for the development of high-potential STEM education and career pipelines for veterans and transitioning service members. Of course, the overall success of this STEM pipeline would be dependent upon the capacity for local networks to identify high growth STEM occupations that connect to military transferrable skills as well as the degree of collaboration between postsecondary institutions and employers in leveraging these skills in diverse career pathways.

Overall Participation in STEM: The majority of those in the labor force are not in STEM occupations (6% compared to 94%). Veterans, however, represent a larger proportion in STEM occupations compared to nonveterans (8% compared to 6%).

Veteran Participation in STEM fields: Veterans are 1.47 times more likely to be in a STEM occupation compared to nonveterans.

Veteran Trends in STEM fields: Veterans entered into STEM occupations at an increasing annual rate of 0.232 percentage points between 2012 and 2016.

Largest Region Concentration of STEM workforce: The South Atlantic region (District of Columbia, Delaware, West Virginia, South Carolina, Maryland, Virginia, Georgia, North Carolina, and Florida) exhibited the largest concentration of veterans in the STEM workforce.

Top STEM Clusters for Veterans: The top two STEM occupation clusters for veterans were the information technology and computer science cluster (43%), followed by the engineering STEM cluster (38%).

STEM Occupations with Growing Veteran Participation: Of the 49 STEM occupations, nearly half (19) exhibited a positive trend of increased veteran participation from 2012 to 2016. Information Security Analysts occupation exhibits the highest odds ratio; veterans are 2.64 times more likely to be in the Information Security Analysts occupation compared to non-veterans. The Information Security Analysts has a positive yearly increase of 0.17 percentage points a year.

Top States for STEM Earnings Growth: Thirty-six (36) of the 51 states (including District of Columbia) exhibited positive trends in the average total annual personal income for veteran STEM workers (in nominal dollars) from 2012 to 2016. The states with the highest positive growth were North Dakota, Connecticut, Wisconsin, Maine, West Virginia, Rhode Island, Nevada, Oklahoma, Tennessee, and South Carolina.

Veteran Earnings in STEM Careers: On average, veterans in STEM occupations earn slightly over 8 percent more than their nonveteran peers ($93,833 compared to $86,676, respectively). Veterans in STEM occupations also tend to out-earn, at even higher rates, both their veteran and non-veteran counterparts in non-STEM fields.

Veteran Unemployment in STEM fields: Veterans in STEM fields tend to experience lower overall unemployment than those in other occupations, although unemployment was slightly higher for veterans in stem compared to nonveterans in STEM.

STEM Occupation Highlights

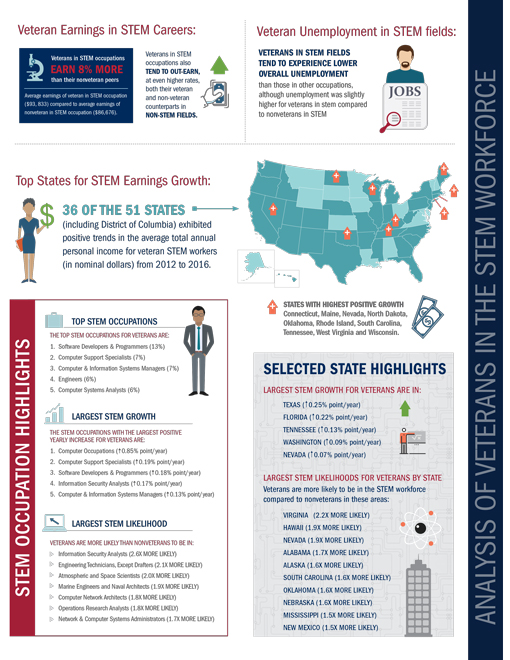
Top STEM Occupations

The top STEM occupations for veterans are:

— Software Developers and Programmers (13%)

— Computer Support Specialists (7%)

— Computer and Information Systems Managers (7%)

— Engineers (6%)

— Computer Systems Analysts (6%)


Largest STEM Occupations Growth

The STEM occupations with the largest positive yearly increase for veterans are:

— Computer Occupations (0.85% point increase per year)

— Computer Support Specialists (0.19% point increase per year)

— Software Developers and Programmers (0.18% point increase per year)

— Information Security Analysts (0.17% point increase per year)

— Computer and Information Systems Managers (0.13% point increase per year)

Largest STEM Likelihoods

Veterans are more likely than nonveterans to be in:

— Information Security Analysts (2.6 times more likely)

— Engineering Technicians, Except Drafters (2.1 times more likely)

— Atmospheric and Space Scientists (2.0 times more likely)

— Marine Engineers and Naval Architects (1.9 times more likely)

— Computer Network Architects (1.8 times more likely)

— Operations Research Analysts (1.8 times more likely)

— Network and Computer Systems Administrators (1.7 times more likely)

Top STEM States and Metropolitan Areas (2012-2016)

Top STEM States:

California (10%)

Texas (9%)

Virginia (8%)

Florida (7%)

Maryland (4%)

North Carolina (4%)

Georgia (3%)

Washington (3%)

Colorado (3%)

Pennsylvania (3%)

Top STEM Metropolitan Areas:

Washington-Arlington-Alexandria, DC-VA-MD (9%)

Dallas-Fort Worth-Arlington, TX (4%)

Los Angeles-Long Beach-Anaheim, CA (3)

New York-Newark-Jersey City, NY-NJ-PA (3%)

Atlanta-Sandy Springs-Roswell, GA (3%)

Vineland-Bridgeton, NJ (2%)

Phoenix-Mesa-Scottsdale, AZ (2%)

Baltimore-Columbia-Towson, MD (2%)

San Diego-Carlsbad, CA (2%)

Seattle-Tacoma-Bellevue, WA (2%)

Selected States Highlights

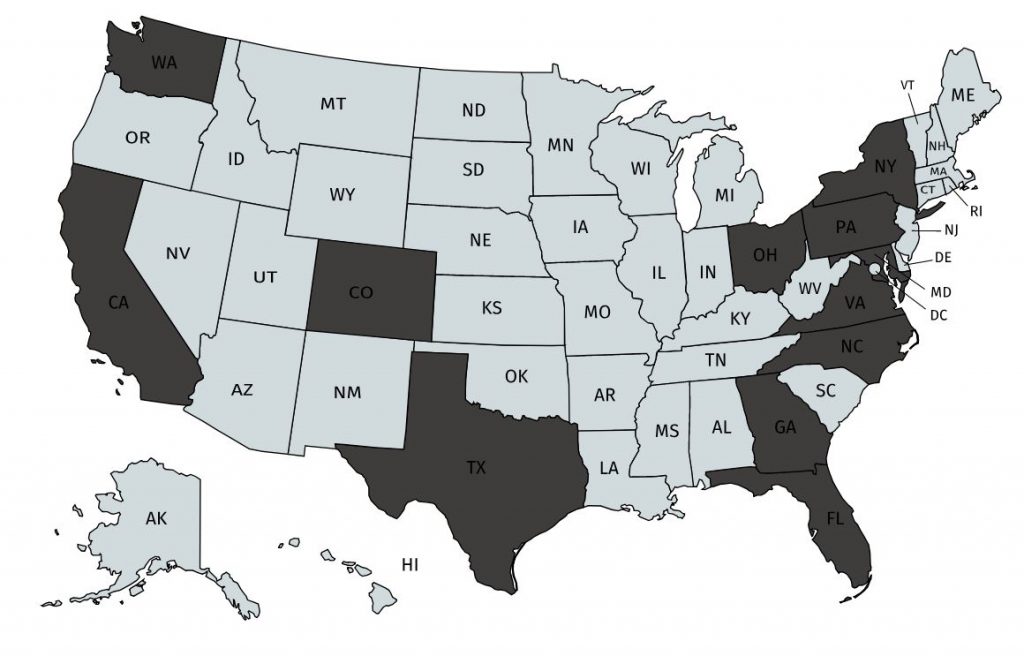
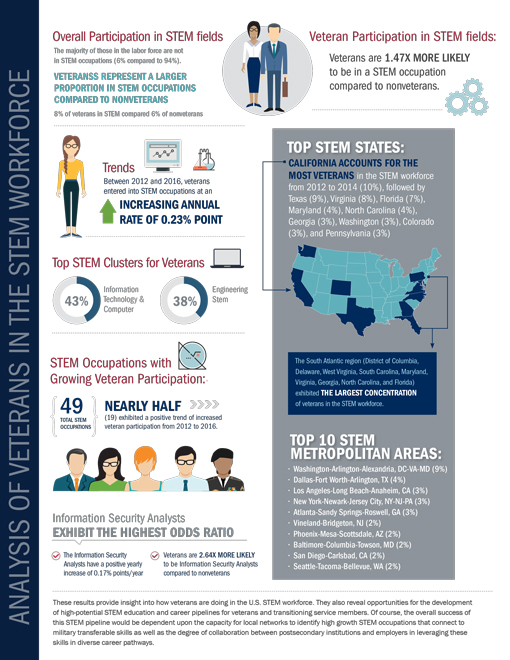
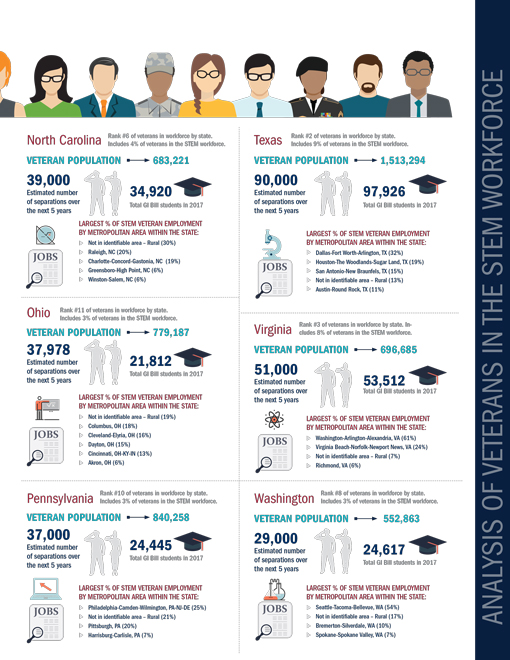
Largest STEM Percentages for Veterans

Largest STEM concentration of veterans in STEM are in:

— California (10%)

— Texas (9%)

— Virginia (8%)

— Florida (7%)

— Maryland (4%)

Largest STEM Growth for Veterans

Largest STEM growth for veterans are in located:

— Texas (25% point increase per year)

— Florida (22% point increase per year)

— Tennessee (13% point increase per year)

— Washington (09% point increase per year)

— Nevada (07% point increase per year)

Largest STEM Likelihoods for Veterans

Veterans are more likely to be in the STEM workforce compared to nonveterans in these areas:

— Virginia (2.2 times more likely)

— Hawaii (1.9 times more likely)

— Nevada (1.9 times more likely)

— Alabama (1.7 times more likely)

— Alaska (1.6 times more likely)

— South Carolina (1.6 times more likely)

— Oklahoma (1.6 times more likely)

— Nebraska (1.6 times more likely)

— Mississippi (1.5 times more likely)

— New Mexico (1.5 times more likely)

What are the top states with veterans in the workforce?

California 

Includes 10% of veterans in the STEM workforce.

Veteran Population: 1,720,635

Estimated number of separations over the next 5 years: 101,000

Total GI Bill students in 2017: 96,361

Largest Percentage of STEM Veteran Employment by Metropolitan Area within the State:

• Los Angeles-Long Beach-Anaheim, CA (24%)
• San Diego-Carlsbad, CA (18%)
• San Francisco-Oakland-Hayward, CA (11%)
• Riverside-San Bernardino-Ontario, CA (10%)
• Sacramento–Roseville–Arden-Arcade, CA (8%)

Texas

Includes 9% of veterans in the STEM workforce.

Veteran Population: 1,513,294

Estimated number of separations over the next 5 years: 90,000

Total GI Bill students in 2017:  97,926

Largest Percentage of STEM Veteran Employment by Metropolitan Area within the State:

• Dallas-Fort Worth-Arlington, TX (32%)
• Houston-The Woodlands-Sugar Land, TX (19%)
• San Antonio-New Braunfels, TX (15%)
• Not in identifiable area – Rural (13%)
• Austin-Round Rock, TX (11%)

Virginia.

Includes 8% of veterans in the STEM workforce.

Veteran Population: 696,685

Estimated number of separations over the next 5 years: 51,000

Total GI Bill students in 2017:  53,512

Largest Percentage of STEM Veteran Employment by Metropolitan Area within the State:

• Washington-Arlington-Alexandria, VA (61%)
• Virginia Beach-Norfolk-Newport News, VA (24%)
• Not in identifiable area – Rural (7%)
• Richmond, VA (6%)

Florida

Includes 7% of veterans in the STEM workforce.

Veteran Population: 1,480,133

Estimated number of separations over the next 5 years: 67,000

Total GI Bill students in 2017: 69,758

Largest Percentage of STEM Veteran Employment by Metropolitan Area within the State:

• Miami-Fort Lauderdale-West Palm Beach, FL (15%)
• Not in identifiable area – Rural (14%)
• Jacksonville, FL (11%)
• Orlando-Kissimmee-Sanford, FL (10%)
• Palm Bay-Melbourne-Titusville, FL (8%)
• Pensacola-Ferry Pass-Brent, FL (4%)

Maryland

Includes 4% of veterans in the STEM workforce.

Veteran Population: 392,771

Estimated number of separations over the next 5 years: 29,000

Total GI Bill students in 2017: 30,382

Largest Percentage of STEM Veteran Employment by Metropolitan Area within the State:

• Washington-Arlington-Alexandria, DC-VA-MD (43%)
• Baltimore-Columbia-Towson, MD (42%)
• Not in identifiable area – Rural (12%)

North Carolina

Includes 4% of veterans in the STEM workforce.

Veteran Population: 683,221

Estimated number of separations over the next 5 years: 39,000

Total GI Bill students in 2017: 34,920

Largest Percentage of STEM Veteran Employment by Metropolitan Area within the State:

• Not in identifiable area – Rural (30%)
• Raleigh, NC (20%)
• Charlotte-Concord-Gastonia, NC (19%)
• Greensboro-High Point, NC (6%)
• Winston-Salem, NC (6%)

Georgia

Includes 3% of veterans in the STEM workforce.

Veteran Population: 662,333

Estimated number of separations over the next 5 years: 39,000

Total GI Bill students in 2017: 31,734

Largest Percentage of STEM Veteran Employment by metropolitan Area within the State:

• Atlanta-Sandy Springs-Roswell, GA (59%)
• Not in identifiable area – Rural (33%)
• Augusta-Richmond County, GA-SC (5%)

Washington

Includes 3% of veterans in the STEM workforce.

Veteran Population: 552,863

Estimated number of separations over the next 5 years: 29,000
Total GI Bill students in 2017: 24,617

Largest Percentage of STEM Veteran Employment by Metropolitan Area within the State:

• Seattle-Tacoma-Bellevue, WA (54%)
• Not in identifiable area – Rural (17%)
• Bremerton-Silverdale, WA (10%)
• Spokane-Spokane Valley, WA (7%)

Colorado

Includes 3% of veterans in the STEM workforce.

Veteran Population: 383,699

Estimated number of separations over the next 5 years: 18,662

Total GI Bill students in 2017: 29,828

Largest Percentage of STEM Veteran Employment by Metropolitan Area within the State:

• Denver-Aurora-Lakewood, CO (51%)
• Colorado Springs, CO (28%)
• Not in identifiable area – Rural (14%)
• Fort Collins, CO (6%)

Pennsylvania

Includes 3% of veterans in the STEM workforce.

Veteran Population: 840,258

Estimated number of separations over the next 5 years: 37,000

Total GI Bill students in 2017: 24,445

Largest Percentage of STEM Veteran Employment by Metropolitan Area within the State:

• Philadelphia-Camden-Wilmington, PA-NJ-DE (25%)
• Not in identifiable area – Rural (21%)
• Pittsburgh, PA (20%)
• Harrisburg-Carlisle, PA (7%)

Ohio

Includes 3% of veterans in the STEM workforce.

Veteran Population: 779,187

Estimated number of separations over the next 5 years: 37,978

Total GI Bill students in 2017: 21,812

Largest Percentage of STEM Veteran Employment by Metropolitan Area within the State:

• Not in identifiable area – Rural (19%)
• Columbus, OH (18%)
• Cleveland-Elyria, OH (16%)
• Dayton, OH (15%)
• Cincinnati, OH-KY-IN (13%)
• Akron, OH (6%)

New York

Includes 3% of veterans in the STEM workforce.

Veteran Population: 789,553

Estimated number of separations over the next 5 years: 37,000

Total GI Bill students in 2017: 31,429

Largest Percentage of STEM Veteran Employment by Metropolitan Area within the State:

• New York-Newark-Jersey City, NY-NJ-PA (37%)
• Not in identifiable area – Rural (19%)
• Rochester, NY (11%)
• Albany-Schenectady-Troy, NY (9%)
• Buffalo-Cheektowaga-Niagara Falls, NY (8%)
• Syracuse, NY (7%)