
Overview
On January 9th , the Bureau of Labor Statistics (BLS) reported that employment changed little in December (+50,000) continuing the long-term trend. The December unemployment rate, at 4.6 percent, was little changed from November. Employment notably increased in food service, healthcare, and social assistance in December, while decreasing in retail trade. Federal government employment was little changed in December (+2,000).[1] Among veterans, unemployment increased from 3.4 percent in November 2025 to 3.9 percent in December 2025. Post-9/11 veteran unemployment also increased from 4.3 percent in November to 5.1 percent in December. Unemployment patterns vary across veteran demographic groups.
Across age groups, unemployment among veterans varies. For veterans aged 18–24, the unemployment rate increased from 11.6 percent in November to 14.8 percent in December and is higher than the nonveteran rate (8.4 percent). Among veterans aged 25–34, unemployment increased from 4.4 percent to 6.9 percent and is now higher than the nonveteran rate which decreased to 4.0 percent. For veterans aged 35–44, unemployment increased from 4.3 percent to 5.3 percent and is higher than the nonveteran rate (3.3 percent). Among veterans aged 45–54, unemployment increased from 1.9 percent to 2.2 percent but remains below the nonveteran rate (3.1 percent). For veterans aged 55–64, unemployment decreased from 2.9 percent to 2.2 percent and is now lower than the nonveteran rate (3.1 percent). Among veterans aged 65 and older, unemployment increased from 3.1 percent to 3.5 percent and is now higher than the nonveteran rate which declined to 2.6 percent in December.
The unemployment rate for female veterans reversed a November decline to 2.5 percent, returning to 4.5 percent, similar to the 4.6 percent reported in September. The December unemployment rate for women veterans of 4.7 percent is higher than the rate for nonveteran women (3.8 percent). The unemployment rate for male veterans increased from 3.5 percent to 3.8 percent and remains below the rate for nonveteran men (4.1 percent).
The unemployment rate for Black or African American veterans decreased from 7.7 percent in November to 6.6 percent in December, and remains below the unemployment rate of their nonveteran counterparts (6.9 percent). The unemployment rate for Hispanic, Latino/a, or Spanish Origin veterans increased from 3.4 percent to 4.3 percent, but remains lower than the unemployment rate of their nonveteran counterparts (4.8 percent). However, readers should be cautioned that data on specific veteran subgroups can vary widely from month to month.
Demographics & Trends
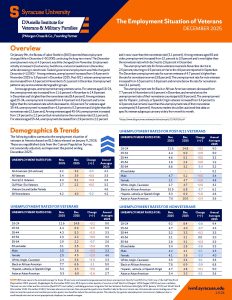
The following tables summarize the employment situation of veterans in America based on BLS data released on January 9, 2026. These are unpublished data from the Current Population Survey, not seasonally adjusted, and represent the period ending December 2025.
| UNEMPLOYMENT RATES FOR: | November 2025 | December 2025 | CHANGE (+/-) | Averages 2025 |
| All Americans (18 and over) | 4.2 | 3.9 | -0.3 | 4.1 |
| All Veterans | 3.4 | 3.9 | +0.5 | 3.5 |
| Post-9/11 Veterans | 4.3 | 5.1 | +0.8 | 3.6 |
| Gulf-War I Era Veterans | 1.7 | 2.2 | +0.5 | 3.2 |
| Vietnam Era and Earlier Periods | – | – | 4.6 | |
| All Nonveterans | 4.2 | 4.0 | -0.2 | 4.2 |
| UNEMPLOYMENT RATES FOR VETERANS | ||||
| Demographic Category | November 2025 | December 2025 | CHANGE (+/-) | Annual Averages 2025 |
| 18–24 | 11.6 | 14.8 | +3.2 | 9.0 |
| 25-34 | 4.4 | 6.9 | +2.5 | 5.0 |
| 35-44 | 4.3 | 5.3 | +1.0 | 3.3 |
| 45-54 | 1.9 | 2.2 | +0.3 | 3.2 |
| 55-64 | 2.9 | 2.2 | -0.7 | 2.6 |
| 65 and older | 3.1 | 3.5 | +0.4 | 3.9 |
|
|
|
|
|
|
| Male | 3.5 | 3.8 | +0.3 | 3.3 |
| Female | 2.5 | 4.5 | +2.0 | 4.6 |
|
|
|
|
|
|
| White, Anglo, Caucasian | 2.4 | 3.4 | +1.0 | 3.3 |
| Black or African American | 7.7 | 6.6 | -1.1 | 5.0 |
| Hispanic, Latino/a, or Spanish Origin | 3.4 | 4.3 | +0.9 | 4.0 |
| Asian or Asian American | 5.3 | 6.9 | +1.6 | 2.7 |
| UNEMPLOYMENT RATES FOR POST-9/11 VETERANS | ||||
| Demographic Category | November 2025 | December 2025 | CHANGE (+/-) | Annual Averages 2025 |
| 18–24 | 11.6 | 14.8 | +3.2 | 9.0 |
| 25-34 | 4.4 | 6.9 | +2.5 | 5.0 |
| 35-44 | 4.6 | 5.1 | +0.5 | 3.3 |
| 45-54 | 1.8 | 2.4 | +0.6 | 1.9 |
| 55-64 | 6.6 | 3.2 | -3.4 | 3.2 |
| 65 and older | – | – | – | 0.2 |
|
|
|
|
|
|
| Male | 4.7 | 5.2 | +0.5 | 3.4 |
| Female | 2.1 | 4.7 | +2.6 | 4.8 |
|
|
|
|
|
|
| White, Anglo, Caucasian | 2.7 | 4.7 | +2.0 | 3.2 |
| Black or African American | 10.5 | 6.8 | -3.7 | 6.1 |
| Hispanic, Latino/a, or Spanish Origin | 5.3 | 6.9 | +1.6 | 4.6 |
| Asian or Asian American | 7.6 | 10.0 | +2.4 | 3.6 |
| UNEMPLOYMENT RATES FOR NONVETERANS | ||||
| Demographic Category | November 2025 | December 2025 | CHANGE (+/-) | Annual Averages 2025 |
| 18–24 | 9.2 | 8.4 | -0.8 | 9.4 |
| 25-34 | 4.7 | 4.0 | -0.7 | 4.3 |
| 35-44 | 3.2 | 3.3 | +0.1 | 3.3 |
| 45-54 | 3.1 | 3.1 | 0.0 | 3.0 |
| 55-64 | 2.8 | 3.1 | +0.3 | 2.9 |
| 65 and older | 3.4 | 2.6 | -0.8 | 3.3 |
|
|
|
|
|
|
| Male | 4.2 | 4.1 | -0.1 | 4.3 |
| Female | 4.1 | 3.8 | -0.3 | 4.0 |
|
|
|
|
|
|
| White, Anglo, Caucasian | 3.5 | 3.4 | -0.1 | 3.6 |
| Black or African American | 7.8 | 6.9 | -0.9 | 6.8 |
| Hispanic, Latino/a, or Spanish Origin | 4.7 | 4.8 | +0.1 | 5.0 |
| Asian or Asian American | 3.4 | 3.3 | -0.1 | 3.6 |
NOTE: BLS now reports the national average for those 18 and over, and annual averages presented above are reported directly from BLS. Post-9/11 are of the Gulf War Era II (September 2001-present). Beginning in the December 2025 data, BLS reports other periods of service as Gulf War Era I (August 1990-August 2001) and now combines Vietnam-era and other wartime veterans (April 1975 and earlier), combining previous categories that had included the Korean War (July 1950-January 1955) and World War II (December 1941-December 1946). Veterans who served in more than one wartime period are classified only in the most recent one. Veterans who served during one of the selected wartime periods and another peacetime period are classified only in the wartime period. The minority-by-gender unemployment rates are not displayed due to small sample size and are more appropriately displayed as annual averages.
[1] https://www.bls.gov/news.release/archives/empsit_01092026.pdf