
Overview
On December 12th, the Bureau of Labor Statistics (BLS) reported that employment changed little in November (+64,000) and has shown little net change since April. In November, the unemployment rate, at 4.6 percent, was little changed from September. Employment rose in healthcare and construction in November, while federal government continued to lose jobs[1] Among veterans, unemployment increased from 2.6 percent in September 2025 to 3.4 percent in November 2025. Post-9/11 veteran unemployment also increased from 2.4 percent in September to 4.3 percent in November. Unemployment patterns vary across veteran demographic groups.
Across age groups, unemployment among veterans varies. For veterans aged 18–24, the unemployment rate increased from 1.1 percent in September to 11.6 percent in November and is higher than the nonveteran rate (9.2 percent). Among veterans aged 25–34, unemployment increased from 3.2 percent to 4.4 percent and remains slightly lower than the nonveteran rate (4.7 percent). For veterans aged 35–44, unemployment increased from 2.6 percent to 4.3 percent and is higher than the nonveteran rate (3.2 percent). Among veterans aged 45–54, unemployment declined from 2.5 percent to 1.9 percent and remains below the nonveteran rate (3.1 percent). For veterans aged 55–64, unemployment increased from 2.1 percent to 2.9 percent and is slightly higher than the nonveteran rate (2.8 percent). Among veterans aged 65 and older, unemployment declined from 3.3 percent to 3.1 percent and is slightly below the nonveteran rate (3.4 percent).
The unemployment rate for female veterans declined from 4.6 percent in September to 2.5 percent in November and is lower than the rate for nonveteran women (4.1 percent). The unemployment rate for male veterans increased from 2.3 percent to 3.5 percent and remains below the rate for nonveteran men (4.2 percent).
The unemployment rate for Black or African American veterans increased from 4.0 percent in September to 7.7 percent in November, though it remains below the unemployment rate of their nonveteran counterparts (7.8 percent). The unemployment rate for Hispanic, Latino/a, or Spanish Origin veterans decreased from 6.1 percent to 3.4 percent, which is lower than the unemployment rate of their nonveteran counterparts (4.7 percent). However, readers should be cautioned that data on specific veteran subgroups can vary widely from month to month.
Demographics & Trends
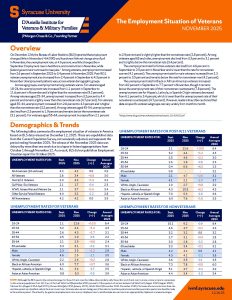
The following tables summarize the employment situation of veterans in America based on BLS data released on December 12, 2025. These are unpublished data from the Current Population Survey, not seasonally adjusted, and represent the period ending November 2025. The release of the November 2025 data was delayed by more than one week due to a lapse in federal appropriations from October 1 through November 12. As a result, BLS did not publish an Employment Situation report for October 2025.
| UNEMPLOYMENT RATES FOR: | September 2025 | November 2025 | CHANGE (+/-) | Annual Averages 2024 |
| All Americans (18 and over) | 4.2 | 4.2 | 0.0 | 3.9 |
| All Veterans | 2.6 | 3.4 | +0.8 | 3.0 |
| Post-9/11 Veterans | 2.4 | 4.3 | +1.9 | 3.2 |
| Gulf-War I Era Veterans | 2.1 | 1.7 | -0.4 | 2.3 |
| WWII, Korean War and Vietnam Era | 2.1 | 3.7 | +1.6 | 3.4 |
| Other service period veterans | 4.4 | 3.2 | -1.2 | 2.8 |
| All Nonveterans | 4.2 | 4.2 | 0.0 | 3.9 |
| UNEMPLOYMENT RATES FOR VETERANS | ||||
| Demographic Category | September 2025 | November 2025 | CHANGE (+/-) | Annual Averages 2024 |
| 18–24 | 1.1 | 11.6 | +10.5 | 6.4 |
| 25-34 | 3.2 | 4.4 | +1.2 | 4.3 |
| 35-44 | 2.6 | 4.3 | +1.7 | 3.1 |
| 45-54 | 2.5 | 1.9 | -0.6 | 2.2 |
| 55-64 | 2.1 | 2.9 | +0.8 | 2.4 |
| 65 and older | 3.3 | 3.1 | -0.2 | 3.1 |
|
|
|
|
|
|
| Male | 2.3 | 3.5 | +1.2 | 2.9 |
| Female | 4.6 | 2.5 | -2.1 | 3.5 |
|
|
|
|
|
|
| White, Anglo, Caucasian | 2.2 | 2.4 | +0.2 | 2.8 |
| Black or African American | 4.0 | 7.7 | +3.7 | 3.6 |
| Hispanic, Latino/a, or Spanish Origin | 6.1 | 3.4 | -2.7 | 3.5 |
| Asian or Asian American | 5.8 | 5.3 | -0.5 | 3.9 |
| UNEMPLOYMENT RATES FOR POST-9/11 VETERANS | ||||
| Demographic Category | September 2025 | November 2025 | CHANGE (+/-) | Annual Averages 2024 |
| 18–24 | 1.1 | 11.6 | +10.5 | 6.4 |
| 25-34 | 3.2 | 4.4 | +1.2 | 4.3 |
| 35-44 | 2.5 | 4.6 | +2.1 | 3.0 |
| 45-54 | 2.6 | 1.8 | -0.8 | 2.3 |
| 55-64 | 0.4 | 6.6 | +6.2 | 1.3 |
| 65 and older | 0.8 | – | – | 3.2 |
|
|
|
|
|
|
| Male | 2.1 | 4.7 | +2.6 | 3.1 |
| Female | 4.1 | 2.1 | -2.0 | 3.7 |
|
|
|
|
|
|
| White, Anglo, Caucasian | 1.9 | 2.7 | +0.8 | 2.9 |
| Black or African American | 4.3 | 10.5 | +6.2 | 4.3 |
| Hispanic, Latino/a, or Spanish Origin | 7.9 | 5.3 | -2.6 | 3.6 |
| Asian or Asian American | 6.0 | 7.6 | +1.6 | 3.5 |
| UNEMPLOYMENT RATES FOR NONVETERANS | ||||
| Demographic Category | September 2025 | November 2025 | CHANGE (+/-) | Annual Averages 2024 |
| 18–24 | 10.1 | 9.2 | -0.9 | 8.4 |
| 25-34 | 4.6 | 4.7 | +0.1 | 4.3 |
| 35-44 | 3.2 | 3.2 | 0.0 | 3.2 |
| 45-54 | 2.7 | 3.1 | +0.4 | 2.8 |
| 55-64 | 3.0 | 2.8 | -0.2 | 2.8 |
| 65 and older | 3.3 | 3.4 | +0.1 | 3.1 |
|
|
|
|
|
|
| Male | 4.2 | 4.2 | 0.0 | 4.1 |
| Female | 4.3 | 4.1 | -0.2 | 3.8 |
|
|
|
|
|
|
| White, Anglo, Caucasian | 3.6 | 3.5 | -0.1 | 3.5 |
| Black or African American | 7.3 | 7.8 | +0.5 | 6.0 |
| Hispanic, Latino/a, or Spanish Origin | 5.1 | 4.7 | -0.4 | 4.9 |
| Asian or Asian American | 4.4 | 3.4 | -1.0 | 3.4 |
NOTE: Although the BLS reports the national average for those 16 and over, the tables above include only those that are 18 and over to make a more accurate comparison to the veteran population. Post-9/11 are of the Gulf War Era II (September 2001-present). Other periods of service include Gulf War Era I (August 1990-August 2001), Vietnam Era (August 1964-April 1975), Korean War (July 1950-January 1955), World War II (December 1941-December 1946). Veterans who served in more than one wartime period are classified only in the most recent one. Veterans who served during one of the selected wartime periods and another peacetime period are classified only in the wartime period. The minority-by-gender unemployment rates are not displayed due to small sample size and are more appropriately displayed as annual averages.
[1] https://www.bls.gov/news.release/archives/empsit_12162025.pdf