
The Story of V-Start: The Veterans Strategic Analysis & Research Tool
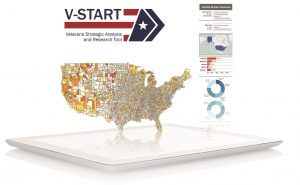
V-START
 The effort to advance the lives of America’s nearly 20 million veterans and their families is carried out by a wide range of organizations, ranging from local nonprofits to federal agencies.
Serving the military-connected community well requires understanding who these veterans are, where they are located, and their specific needs. This knowledge is built upon insights generated through data. While the data sources that might inform these stakeholders are abundant, many are difficult to access.
Data use restrictions, timely access, fragmented ownership across organizations, and questionable reliability, are among a laundry list of barriers and limitations. Even so, private and social sector organizations are coming to terms with the fact that data and insights help drive action and impact.
Since its inception in 2011, the Institute for Veterans and Military Families (IVMF) Research and Evaluation (R&E) team has evolved to help meet this rising need for data, knowledge, and insights. State governments wanted to know more about their veteran populations; Veteran Service Organization (VSO) were seeking data to support their services and advocacy efforts, and researchers and groups of all types were looking for insights on the veteran population.
The challenge with this, however, was not that the data did not exist. In fact, many information requests could be satisfied through publicly available datasets produced by government agencies. Rather, it became increasingly apparent that most of the stakeholders seeking information and analysis lacked the technical capability or the time to make sense of the mass amount of information in its many locations and formats.
Responding to each outside information request with fresh analysis was inefficient—to the point of monopolizing the R&E team’s time and resources. But, within this challenge, the team recognized an opportunity. The consistently high level of interest in general statistics on veterans suggested that accessing public data was not a simple task. There was a clear need for an easy, user-friendly interface for various stakeholders to explore data in ways that quickly answer questions related to the veterans they serve. Meeting this need would not only relieve pressure on IVMF resources, but also fill an important resource gap to keep people and organizations across the country informed and data-driven in their efforts to enact policies and programs.
IVMF Collaboration with Deloitte
As the IVMF R&E team took on more projects, they sought out new ways to improve external stakeholders’ access to accurate and reliable data on the military-connected population. One significant strategic advantage for the team was their collaborative relationship with Deloitte. Bringing complimentary expertise and resources, Deloitte was eager to help the R&E team explore new tools and approaches to bring insights to the veteran service delivery space more efficiently and effectively.
Prior to teaming with the IVMF, Deloitte had long provided a variety of services to support veterans on the local and national levels. This includes sponsoring the Warrior Games, providing pro bono services to veteran-focused nonprofits (both large and small), and conducting a three-day transition workshop for transitioning service members at no cost—the Career Opportunity Redefinition and Exploration (CORE) Leadership Program, held at Deloitte University.
Beginning in late 2014, the Deloitte and IVMF teams met with the aim of mapping out exactly where and how data and analytics could address this information demand. The collaboration kicked off in Deloitte’s Greenhouse, an innovative environment designed to disrupt conventional thinking, spur creativity, and ultimately inform tangible solutions. The emergent idea of the session was to create a visualization tool to help users easily find public data, interpret it, and extract key insights.
The Deloitte and IVMF teams knew that thoughtfully designed visualizations could combine datasets in meaningful ways to inform a diverse range of interested stakeholders. More importantly, making these visualizations interactive would allow users to manipulate and explore patterns in the data on their own, and tailor them to meet their own policy and practice needs. Large nonprofits could use visualizations to see where their programming is needed most. Federal grants managers could be more discerning in how to allocate funds to specific organizations and geographic regions that maximize value and impact on underserved populations. Local providers could identify issues in their communities and inform what programs they needed to better support their veterans. By providing not only access to data, but also a way to illuminate the stories within, data visualizations are a powerful tool in meeting the rising demand for information.
Creation of the Veterans Strategic Analysis & Research Tool (V-START)
By early 2015, IVMF and Deloitte decided to focus its initial data visualization efforts on pressing issues with industry-recognized, public datasets that were best suited for providing insights and answering key questions. At the time, challenges of the transition from military to civilian life as well as veteran unemployment and economic opportunity were topics of national interest—and remain to be of interest today. Fortunately, there are numerous datasets with demographic, education, and employment information about veterans that can help shed some light on these topics. However, each dataset has strengths and limitations and may reside within larger, disparate datasets with multiple owners. IVMF and Deloitte hoped that providing a more efficient way to aggregate and analyze this information would improve the ability of VSOs, public sector partners, and veterans to navigate the veteran employment and transition landscape.
In addition to considering which policy and issue areas to focus on, the IVMF/Deloitte team wanted to select a visualization platform that would be simple to work with for both the developer and the user. The software was chosen for its ability to accomplish both goals. The chosen software could host visualizations on a public server and embed them into the IVMF website; additionally, it was easy for users to interact with the data and download PDF files and images for their general use.
The ability to overlay data from different sources into one image was a key characteristic of these initial visualizations. The team also built in a functionality that allowed for geographic comparisons between metropolitan statistical areas, counties, and states. The first four dashboards for public consumption were published on the IVMF website in the fall of 2016. Several more dashboards were developed and prepared for both future rollout and internal IVMF use. Throughout the following year, the IVMF/Deloitte team provided multiple in-person demonstrations of the tool and its capabilities to government and social sector stakeholders across the country to increase awareness and engagement.
V-START in Action: Veteran Unemployment
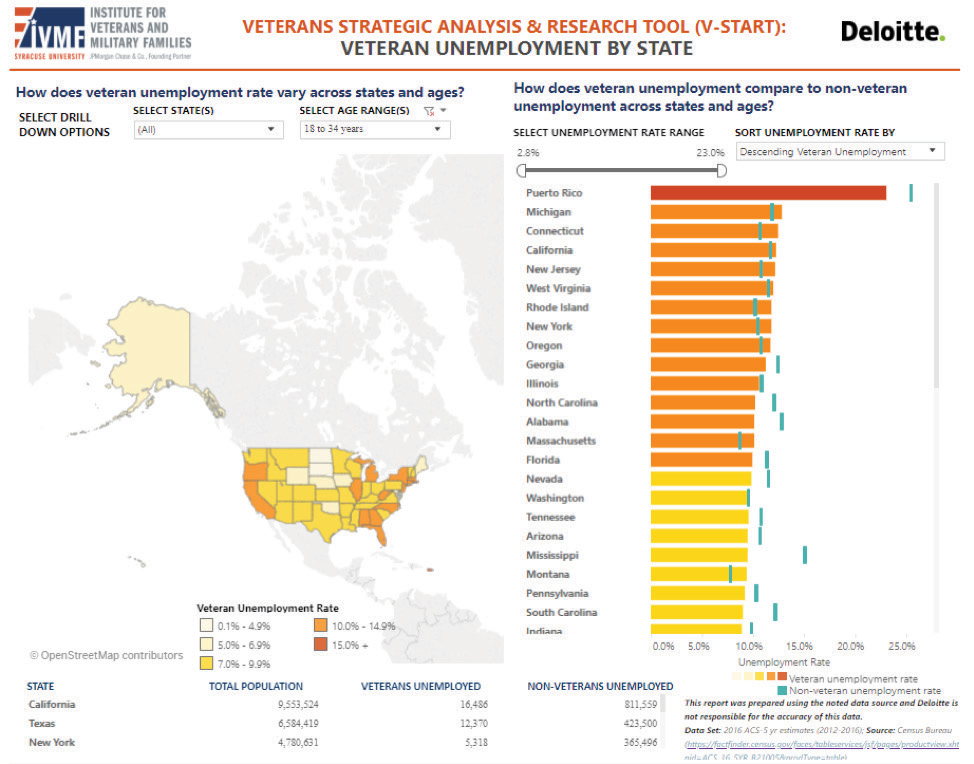
The above visualization depicts the veteran unemployment rate of 18 to 34-year-olds by state. Darker shades of color on the map indicate a higher rate of unemployment. The list and bar chart on the right creates a ranking of states in terms of veteran unemployment rate amongst veterans in the specified age range. Additionally, the blue bar in that bar chart identifies the unemployment rate of non-veterans.
This type of visualization has practical uses for all types of people involved in the veteran community. Veterans themselves can use the tool to easily grade a state’s veteran employment outlook for veterans their age and compare that outlook to other states and non-veterans within that state. However, the tool also has value to those who serve veterans. Communities, in particular, have the greatest potential impact on veteran well-being. Yet, finding the right data is a major challenge for many seeking to learn more about their veteran population. Arming communities with easy-to-find data visualizations provides story-telling power to better advocate for and provide data-driven care and support to their local veterans.
Data visualizations like this offer value to virtually all stakeholders focusing on advancing the lives of veterans and their families. VSOs can use it as an advocacy tool to show a specific need or problem. Policymakers can use the data to inform their decisions in how they address a specific problem. Finally, policy analysts and evaluators can utilize visualization capability to assess potential impacts over time.
Sparking Internal Data Analytics Capabilities through V-START
 Beyond launching V-START, the process of creating such a tool itself was a catalyst to transforming the IVMF’s thinking and use of data visualizations as a communication tool for program insights, outputs, and outcomes to both internal and external stakeholders. Data analytics soon became a key component of most projects. The R&E team first sought out the data science skills of graduate students from Syracuse University’s School of Information Studies (iSchool), who would serve as developers and data consultants. Even today, these students work closely with teams across the Institute as well as with Deloitte to design and develop new dashboards. Many of these dashboards have been beneficial to IVMF leadership and managers seeking to assess and compare the Institute’s nationally scaled programs, particularly by location, region, and military installation. The above visualization was developed for a federal agency to help identify counties where a program that the IVMF helped deliver would be most effective. Users set benchmarks on criteria, and V-START maps which counties meet them.
An example of the success of one of the more recent data visualization initiatives that V-START helped inspire is the AmericaServes Insights Dashboard. AmericaServes is a national IVMF initiative that helps communities build coordinated networks of providers serving veterans, service members, and their families. These networks are supported by a staffed coordination center and a shared technology platform that allows providers to make referrals for clients that need assistance across nearly twenty service categories. The AmericaServes dashboard also uses software to map the locations of communities actively coordinating around the country, and shares key data that can be filtered by network. The maps, graphs, tables, and indicators tell an important story about the initiative’s national and local impact, and gives communities a transparent framework to report on their growth, progress, and trends. Coordination center teams and service providers across the country have already incorporated a simple PDF printout of the dashboard into their reports to their boards of directors, state and local veteran working groups, and broader presentations in the community.
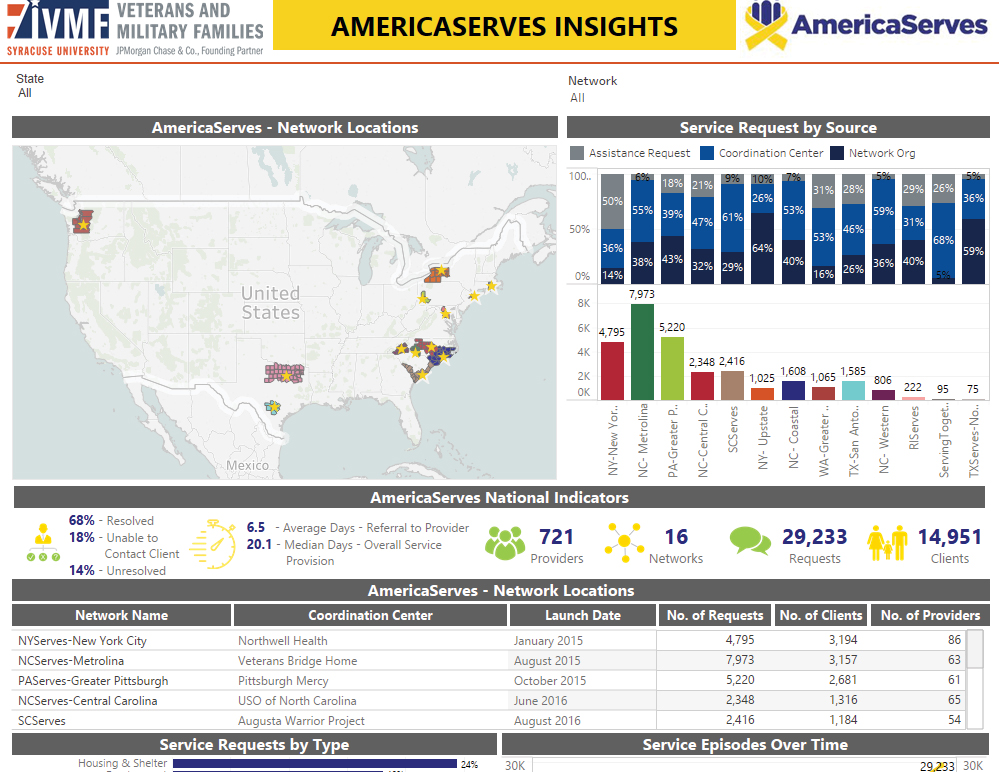
The AmericaServes Dashboard provides insight to all AmericaServes Networks across the country. The visualization maps out the networks, breaks down service requests by source and type, and gives metrics like number of requests over time and by network. The data tells a story of types and quantity of demand for AmericaServes in its communities. Providers, veterans, or stakeholders operating in a network can select their network in the top drop-down bar to gain nuanced insight to the differences in how networks perform and function.
This data visualization is unique not only in the story it tells, but in the real-time transparency it provides. As society becomes more data-driven, organizations are increasingly expected to provide performance measurement and evaluation that demonstrates their efforts are having an impact. The AmericaServes dashboard is an example of the transparency and insight data should provide.
V-START’s Future – Iteration and Improvement
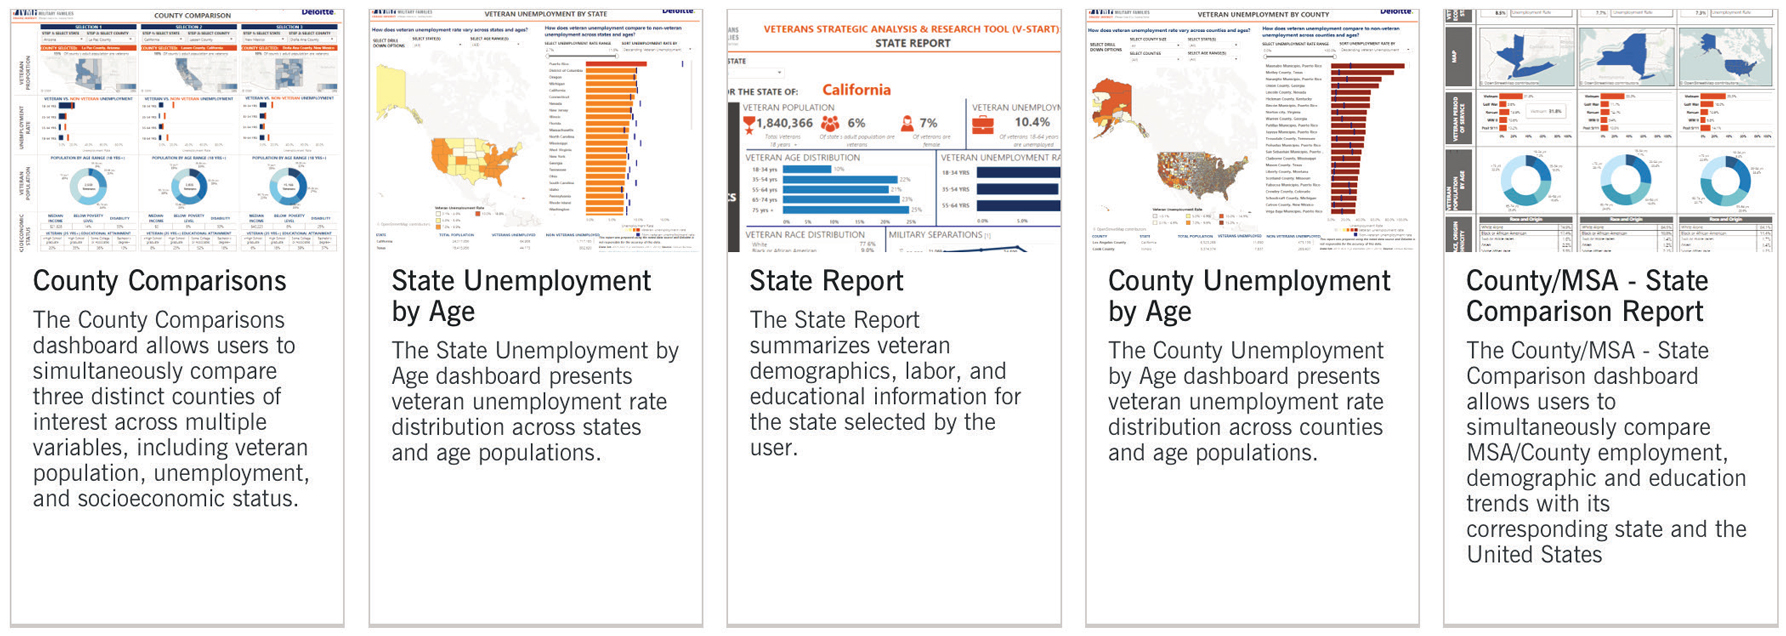
Today, there are five V-START dashboards available to the public on IVMF’s website. Several of the current dashboards have undergone revisions from their initial design, both in the form of improvements to the back-end dashboard construction, and improving design elements based on end-user feedback. The content and data behind the visualizations are refreshed as often as the source data is updated and made available to the public.
The story behind V-START is one in which two organizations recognized complementary talents and aligned their priorities to further an important mission. The true power is unlocked when other organizations operating in public, private, and nonprofit sectors begin seeing data visualizations as an opportunity to collaborate, to share data, and to bring their insights to the public to improve the quality of veterans’ lives.
V-START represents a practical starting point, but ultimately there is much more to be done. Organizations that work with veterans each have a unique perspective on the needs of the population they serve and V-START is a model for all organizations to apply in order to bring their own data to the table and to continuously create new visualizations that provide fresh insights. More open and consumable data can foster shared awareness and a greater potential for innovation in the veteran service space.
A Call to Action – We Need YOU!
To improve and expand future dashboard offerings, the IVMF/Deloitte team needs to hear from the individuals and organizations that can benefit from the insights and analysis V-START provides. Which dashboards are helpful, but more importantly, what new analysis could be helpful? What would bring greater understanding to those who serve veterans? On the V-START website there is a feedback form for users to deliver instant response(s) about their experience(s) with the tool and how it can be improved. Try the tool. Share your thoughts and ideas. Let’s work together to empower ourselves with the data and tools we need to better serve veterans. This is only the beginning of what we can all achieve together in service to those who served.
ABOUT DELOITTE
“Deloitte” is the brand under which tens of thousands of dedicated professionals in independent firms throughout the world collaborate to provide audit & assurance, consulting, financial advisory, risk advisory, tax and related services to select clients. Deloitte refers to one or more of Deloitte Touche Tohmatsu Limited, a UK private company limited by guarantee (“DTTL”), its network of member firms, and their related entities. DTTL and each of its member firms are legally separate and independent entities. DTTL (also referred to as “Deloitte Global”) does not provide services to clients. In the United States, Deloitte refers to one or more of the US member firms of DTTL, their related entities that operate using the “Deloitte” name in the United States and their respective affiliates. Certain services may not be available to attest clients under the rules and regulations of public accounting. Please see www.deloitte.com/about to learn more about our global network of member firms.
If you are having any trouble with accessibility on this page please contact the IVMF Office at 1-315-443-0141 or email vets@syr.edu. We will be more than happy to work with you and provide you anything you need.
For an accessible PDF version of this article you can click here